Part A: Pupil Premium Strategy 2023-26
Reviewed date: October 2024
Statement of Intent
Our intention is that all pupils, irrespective of their background or the challenges they face, make good progress and attain well across the curriculum. This strategy runs from September 2023 to July 2026, but is reviewed regularly and at least yearly.
The focus of our pupil premium strategy is to support disadvantaged pupils to achieve that goal, including progress for those who are already high attainers. We will consider the challenges faced by vulnerable pupils, such as those who have a social worker and young carers. The activity we have outlined in this statement is also intended to support their needs, regardless of whether they are disadvantaged or not.
High-quality teaching is at the heart of our approach, with a focus on areas in which disadvantaged pupils require the most support. This is proven to have the greatest impact on closing the disadvantage attainment gap and at the same time will benefit the non-disadvantaged pupils in our school. Implicit in the intended outcomes detailed below, is the intention that non-disadvantaged pupils’ attainment will be sustained and improved alongside progress for their disadvantaged peers.
Our approach will be responsive to common challenges and individual needs, rooted in robust diagnostic assessment, not assumptions about the impact of disadvantage. The approaches we have adopted complement each other to help pupils excel. To ensure they are effective we will:
- ensure disadvantaged pupils are challenged in the work that they’re set
- act early to intervene at the point need is identified
- adopt a whole school approach in which all staff take responsibility for disadvantaged pupils’ outcomes and raise expectations of what they can achieve
- further develop our belonging and inclusion strategy to ensure all pupils, especially those experiencing disadvantage, feel celebrated and have clear purpose.
Challenges
The table below outlines the key challenges to achievement that we have identified among our disadvantaged pupils.
|
Challenge Number |
Details of the Challenge |
|
1 |
General academic disadvantage. We use GL Assessment to understand about the prior attainment as students start at the school. Evidence from these assessments show that students eligible for the pupil premium are already academically disadvantaged. Upon entry into the school, students who experience disadvantage were found to be below their more affluent peers in maths and English. At GCSE, there remains a progress gap between PP and non-PP students. Students who are NEET are more likely to be PP. |
|
2 |
Poorer reading and spelling, upon entry into the school. Nationally standardised reading and spelling tests are taken every year as part of our ongoing monitoring of student outcomes. Students from disadvantaged backgrounds tend to enter the school with lower reading ages and spelling competency than their more affluent peers. Typically upon entry, disadvantaged students are 8 months behind their more affluent peers in spelling and score 5 SAS (standardised age score) behind in reading ability. |
|
3 |
Poorer organisational skills. From our experience and observation, students from more disadvantaged backgrounds tend to face specific organisational challenges at the school. This includes accessing and completing homework, punctuality to school, bringing in the correct equipment and wearing the correct uniform. |
|
4 |
More complex pastoral issues that impact on academic performance. From our experience and observation, students from more disadvantaged backgrounds tend to face a greater range of pastoral challenges. This includes mental health issues, challenging familial and peer relationships, poor behaviour, safeguarding concerns and other problems often associated with low economic circumstances. The number of concerns regarding disadvantaged students last year was almost 7 times greater than for more affluent peers. |
|
5 |
Poor attendance. From our experience and observation, students from more disadvantaged backgrounds tend to be absent from school more frequently. Last year, the attendance rate for students who experience disadvantage was 84.41%, compared to 89.72% whole school attendance. |
Intended Outcomes
This explains the outcomes we are aiming for by the end of our current strategy plan (2023-26), and how we will measure whether they have been achieved.
|
Intended Outcome |
Success Criteria |
|
Improve general academic outcomes relative to peers. |
At the time of our first published public examinations (academic year 2023/24) disadvantaged students achieve above a P8 of 0.0 and be above the P8 for PP nationally. In the absence of P8 measures, in 2025 and 2026, outcomes for PP students will remain above National outcomes for PP students. |
|
Improve reading and spelling |
Reading comprehension tests and spelling tests demonstrate improved comprehension skills among disadvantaged pupils and a smaller disparity between the scores of disadvantaged pupils and their non-disadvantaged peers. Teachers should also have recognised this improvement through engagement in lessons and book scrutiny. |
|
Improve organisational skills |
From Year 9 onwards, there is a significant reduction in the number of sanctions awarded for organisation, uniform and homework. |
|
Reduce the impact of pastoral issues |
Year-on-year improving pastoral systems mean that there are decreases in the number of students being suspended, needing extensive external intervention and missing learning because of pastoral, safeguarding or behavioural issues. |
|
Improve attendance |
Sustained high attendance from 2024/25 demonstrated by the overall absence rate for all pupils being below Bristol and National, and the attendance gap between disadvantaged pupils and their non-disadvantaged peers being reduced to no more than 2%. |
Activity in this academic year
This details how we intend to spend our pupil premium (and recovery premium funding) in the 2024/25 academic year to address the challenges listed above.
Predicted Income: £299,775
|
Anticipated PP Grant based on current numbers |
£274,050 |
||
|
LAC funding |
£25,725 |
||
|
TOTAL |
£299,775 |
||
Teaching (for example, CPD, recruitment and retention)
Budget cost for the below: £42,292
|
24/25 |
|||
|
Teaching |
|||
|
Standardised GL assessments 30% of £11897 and administration |
£6,754 |
||
|
40% costs of small school (M4 teacher 50% of time £25,000) |
£10,000 |
||
|
Year 11 revision guides |
£500 |
||
|
Classcharts communication module |
£1,386 |
||
|
EAL Support for PP students - including TLR for lead and resources |
£6,652 |
||
|
50% contribution towards music tuition for PP (5160 Music Costs) |
£12,000 |
||
|
LAC students; tutoring and resources |
£5,000 |
||
|
Total |
£42,292 |
||
|
Activity |
Evidence that supports this approach |
Challenge number(s) addressed |
|
Purchase of standardised diagnostic assessments (GL and associated products). Training will be provided for staff to ensure assessments are interpreted correctly. |
Standardised tests can provide reliable insights into the specific strengths and weaknesses of each pupil to help ensure they receive the correct additional support through interventions or teacher instruction. Click here for more details. |
1, 2 |
|
The employment of additional teaching hours - these are deployed for those students who are significantly behind their peers within normal curriculum time. |
This allows for small class sizes for those students (disproportionately PP) who are most in need of specialist and tailored support. This approach is recommended by the EEF. |
1, 2 |
|
Intervention for EAL students who are also PP - Flash Academy software, resources and technology |
Our newer to English students who are EAL are further behind their peers and we need to accelerate their progress |
1, 2 |
|
50% contribution towards music tuition for PP |
Example of evidence here. |
1, 2, 3 |
|
LAC students - tutoring, resources, PSL intervention time |
As per guidance from the Hope School, Bristol |
Pastoral and Behavioural Support
Budgeted cost: £256,705
|
Pastoral and Behavioural Support |
|||
|
Family Liaison Officer and 45% of Attendance Officer (45% of pupils below 92% attendance PP) |
£57,390 |
||
|
50% Centralised OnCall system (Pastoral support) staffed by Pastoral Support Leaders |
£20,000 |
||
|
Uniform, travel and costs towards trips |
£22,000 |
||
|
50% Behaviour Lead salary and 50% Safeguarding Lead targeting PP students |
£49,758.50 |
||
|
Bristol Bears Bright Sparks and Bear in Mind Counselling programmes |
£13,500 |
||
|
Lexia Mentoring and intervention for students with SEMH/ low attendance/ at risk of suspension/ disengaged from education |
£12,600 |
||
|
CST Forest School - Secondary programme. For students at risk of suspension/ socially isolated/ who have experienced trauma. Aimed at building confidence/ relationships and improving engagement with school. |
£8,680 |
||
|
ALP provision for non SEN PP students requiring additional support |
£20,450 |
||
|
Belonging strategy: Parent education events, guest speakers for student events, House event, reward activities for excellent/ improved attendance and behaviour |
£9,500 |
||
|
DHT and AHT Leadership of Belonging, Behaviour, Student Culture and Attendance Strategy (partial salary costs) |
£42,826 |
||
|
Pastoral Total |
£256,705 |
||
|
Activity |
Evidence that supports this approach |
Challenge number(s) addressed |
|
Attendance Support Employment of Family Liaison Officer to support attendance. 45% of Attendance Officer (45% of pupils with below 92% attendance are PP) |
Click here and here for supporting evidence about attendance and here about parental engagement |
3, 4, 5 |
|
Behaviour Support Interventions (including Forest School, use of external providers, small group and individual mentoring and counselling), 50% of behaviour lead targeting PP students |
Click here and here for supporting evidence. Also here for SEMH interventions |
3, 4, 5 |
|
Uniform, travel and costs towards trips |
Meeting basic needs of students and supplementing trip costs to ensure equal access |
3, 4 |
|
Safeguarding Lead targeting PP students |
Click here for supporting evidence |
3, 4, 5 |
|
Belonging Strategy House system, guest speakers and rewards for excellent attendance and behaviour. |
3 |
Part B: Review of Outcomes in the Previous Academic Year (2023/24)
Positive Impact on Academic Outcomes
Y11 public examinations 2024
We have two primary measures for student performance at GCSE. Attainment 8 measures the average grade achieved by students across their 8 strongest subjects. Progress 8 measures the average progress made by students across their 8 strongest subjects relative to their prior attainment. Below are our relative performance indicators (pending official DfE data available in late October 2024)
|
Expected A8 |
Expected P8 |
||
|
Year 11 |
PP |
4.2 |
0.00* |
|
Non-PP |
5.6 |
+0.9** |
*This indicates our PP students are making progress in line with all students in similar schools (PP and non PP).
**This indicates our non PP students are making close to a full grade better progress compared with all students in similar schools (PP and non PP).
This indicates that, while PP students are performing better than their PP peers in similar schools, there is a clear progress gap between our PP students and their non-PP peers.
Y7 - 10 Assessment Data
The rest of our current evidence is drawn primarily from internal assessments (sat at the end of each term) and nationally benchmarked English, maths and science tests (sat yearly). The table below shows how students from PP and non-PP backgrounds have fared across all subjects in our internal summer assessments. It suggests that PP students are broadly performing in line with their more affluent peers.
|
% Above Expected |
% Making Expected |
% Below Expected |
||
|
Year 7 |
PP |
18 |
47 |
11 |
|
Non-PP |
13 |
60 |
17 |
|
|
Year 8 |
PP |
6 |
54 |
23 |
|
Non-PP |
19 |
56 |
14 |
|
|
Year 9 |
PP |
22 |
43 |
19 |
|
Non-PP |
18 |
54 |
21 |
Last year’s Year 10s have been awarded predicted grades following their summer mock exams. Below are the relative performance indicators for PP v non-PP. Initial data suggests that students are that PP students are on track to make positive progress.
|
Predicted A8 |
Predicted P8 |
||
|
Year 10 |
PP |
4.9 |
+0.3 |
|
Non-PP |
6.0 |
+1.2 |
The nationally benchmarked test results, summarised below, also suggest that PP students are making more progress than the average student, nationally. The results also suggest that PP students are, on average, outperforming the national cohort.
|
National Cohort (no data for PP only) |
Trinity PP (+/- since last assessment) |
|
|
English |
100 |
96.6 (-3.8) |
|
Maths |
100 |
99.7 (+2.0) |
|
Science |
100 |
100.3 (+4.4) |
Improve reading. We measure this through nationally benchmarked reading tests, carried out annually. The table below shows a summary of these tests across all years. Results suggest that PP students are making more progress than the average student, nationally. The results also suggest that PP students are, on average, outperforming the national cohort.
|
National Cohort (non data for just PP) |
Trinity PP (+/- since last assessment) |
|
|
Reading |
100 |
101.7 (+1.6) |
The school is yet to experience a year without Covid-19. This makes any analysis of attendance figures – where full and partial closures have occurred and where students are advised to remain home in certain circumstances – problematic. It also makes it difficult to judge the impact of our pastoral support as we continue to see an increase in pandemic-related anxiety and mental health generally.
Reviewing the impact of the recovery grant expenditure. Analysis of maths and English small group tuition, funded in part by the recovery grant, suggests significant improvements beyond the average progress seen across most year groups. This analysis was conducted using GL assessed standard age scores (SAS). Details can be found below.
|
Maths |
English |
|||
|
Year group mean improvement in SAS |
AC mean improvement in SAS |
Year group mean improvement in SAS |
AC mean improvement in SAS |
|
|
Year 7 |
1.9 |
4.1 |
-6.5 |
-1.3 |
|
Year 8 |
-1.8 |
-0.7 |
-0.9 |
8.5 |
|
Year 9 |
6.3 |
15.8 |
1.3 |
1.2 |
Positive Impact on Pastoral Measures
PP numbers 2023-24 33.5% at Trinity compared to 27.3% nationally, our PP cohort is above National average.
Attendance Improvements 2022-23 to 2023-24
As a result of pastoral intervention, funded by the Pupil Premium, we have seen a reduction in persistent absenteeism for students who experience disadvantage between 2022-23 (48% PA) to 2023-24 46% PA). The attendance for PP students 2023-24 fell by 0.3% from the year before, which is line with a National drop in attendance for PP students of 0.3%.
|
Attendance 2022-23 |
Persistent Absenteeism 2022-23 |
Attendance 2023-24 |
Persistent Absenteeism 2023-24 |
|
|
Trinity Academy |
88.82% |
33% |
89.72% |
27.58% |
|
Bristol |
90.5% |
26% |
88.37% |
32.9% (secondaries) |
|
National |
92.6% |
21.2% |
92.8% |
19.2% |
|
PP Trinity Academy |
84.77% |
48% |
84.41% |
46.02% |
|
PP National |
89.2% |
36.5% |
88.9% |
24% |
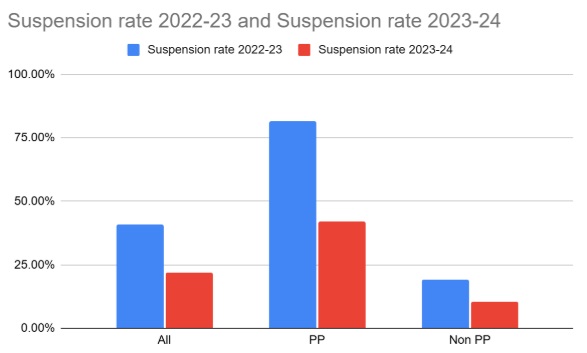
Behaviour Improvements 2022-23 to 2023-24
Suspension rates were halved for all students at Trinity Academy between 2022-23 and 2023-24. For Pupil Premium students, the rate of suspension was also halved from around 80% to 40%. As demonstrated in the graph seen below.
There still remains a gap between the rates that PP and non-PP students are suspended, but this is closing:
2022-23 PP to non-PP gap 62.2%
2023-24 PP to non-PP gap was reduced to 31.4%.